The analytics that delayed the page by 646 ms
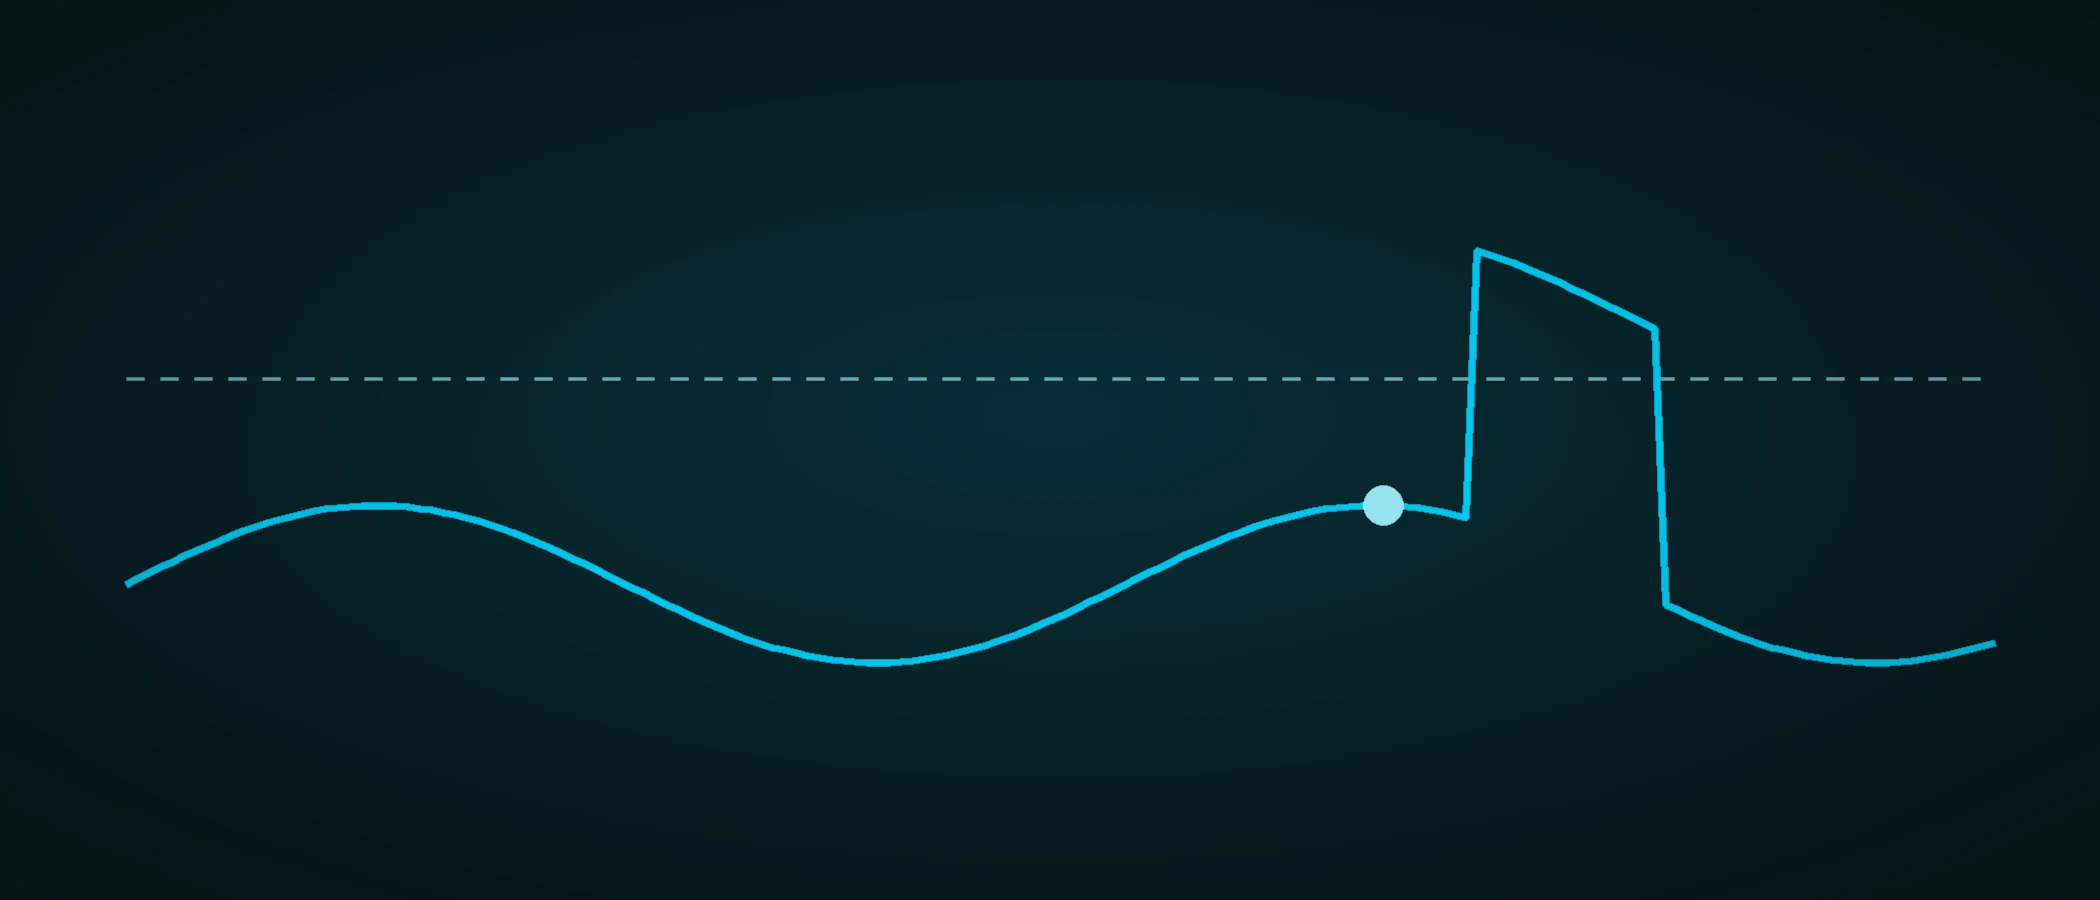
The portfolio loads in 657 ms with analytics beacons turned off. With them on, it loads in 1303 ms. That is 646 ms of difference — nearly double the load time, spent on two requests that have nothing to do with the content the visitor came to read.
The number did not come from a monitoring dashboard. It came from a manual measurement taken on November 4th, alternating the page load with and without the two endpoints. The first reading was disbelief: 646 ms is a lot for two beacon fetch calls, the kind we usually wave away as “just a ping”. The second reading was recognition — the problem was never the response size. It was where the call happened.
The tools I use on this project live in the skills store — the first one is free.
The site has two measurement paths. One sends a hit on every route change, from a component mounted in the layout. The other loads the OpenPanel SDK, which is cookieless and therefore starts without waiting for consent. Both point at same-origin endpoints — /api/hit and /api/op/* — that next.config.js rewrites to external services. And that is the misleading part: a rewrite is not a static file. It is an edge proxy. Every call costs a network round trip the browser could not anticipate, and both were sitting on the critical path.
Where they ran matters: inside the hydration useEffect, before the load event. The worst possible place. The browser was still laying out the page, fetching fonts, resolving styles, and two components decided to open a connection to the edge to announce that someone had arrived. The visitor was waiting on information that matters to me, not to them.
The fix shipped in commit 7f54c6f, on November 5th: “perf(analytics): adia beacons para depois do load”. The idea is a single rule — measurement does not belong on the critical path. It waits for the page to finish loading and then runs on the first idle slot of the main thread.
The helper that does this is 35 lines with one job: schedule a function for after load. If the page has already finished loading — the App Router case, where client-side navigation never fires a new load — it does not even register a listener; it runs on the next idle slot. If the page is still loading, it waits for the event exactly once.
export function agendarAposCarga(fn: () => void): void {
  if (typeof window === "undefined") return;

  const rodarNaFolga = () => {
    if (typeof window.requestIdleCallback === "function") {
      window.requestIdleCallback(() => fn());
      return;
    }
    window.setTimeout(fn, 0);
  };

  if (document.readyState === "complete") {
    rodarNaFolga();
    return;
  }

  window.addEventListener("load", rodarNaFolga, { once: true });
}
Three decisions live in those lines. The first is { once: true }: without it, every navigation would stack another listener and the beacon would fire twice after the first load. The second is requestIdleCallback with a setTimeout fallback — the first hands the function over when the browser is genuinely idle, the second covers environments without the API: jsdom in tests and older Safari in production. The third is the readyState === "complete" short-circuit, which handles the App Router case: client-side navigation never fires load, so waiting for an event that never comes would silently mute the measurement.
The change in both components was one line each: the direct call became a scheduled call. In ConditionalAnalytics.tsx, SDK loading now runs inside the scheduler. In HitBeacon.tsx, the per-route hit follows the same path. No component rewrite, no layout work.
The wrong fix — and the one people reach for first — is a fixed setTimeout. An arbitrary 500 ms delay looks like a solution and is not: on a fast machine the beacon still competes with hydration, on a slow machine it arrives late and the data is skewed. The scheduler does not guess a duration. It waits for a real event (load) and a real condition (an idle thread).
Coverage came with the fix, not after it. Four contract tests: it does not run before load and does run after it; it uses requestIdleCallback when available; with readyState complete it does not depend on load; and it does not throw where window is absent. The test that exercises the fallback deletes requestIdleCallback on purpose, because jsdom lacks the API and so does older Safari. The suite closed at 539 of 539 and next build exited 0.
The practical result is the number that opened this post: load is back around 657 ms when someone arrives, and measurement happens a few milliseconds later, on the idle slot. No data is lost — the hit is still sent, screen_view is still counted. What changes is the order: page first, accounting second.
There is a bigger lesson here, and it goes beyond this portfolio. A metric that delays the page measures the wrong page. If the beacon sits on the critical path, the time it records is no longer the time the visitor felt — it is the time with the instrument hanging around the page’s neck. A measuring instrument cannot be part of what it measures.
The next step is to keep measuring with the same method: turn the suspect off, measure, turn it back on, measure again. The next candidate is the cost of hydrating the SDK itself, which now happens outside load but still occupies the main thread. And the contract test stays in CI, so the next person who needs a new beacon does not repeat the bare useEffect without noticing what it costs.
Related entries
Same project, same ground — the stories connect.
Next step
If this was useful, there is more: I write about the same ground in the other projects, and the store holds the tools I use here.
Done — I will send the next article when it is out.
No spam, one-click unsubscribe. I am also here: Skills store · Portfolio